Key takeaways
- Readers submit anonymous, county-level reports. The form has no free text and never asks for an address, name, email or screenshot.
- Automatic checks stop bots and impossible values. Unusual amounts wait for a second report; duplicates count once.
- A person accepts or rejects every report and never edits one. Rejections are counted by reason and published.
- A county shows a surcharge number at 5 accepted reports, or speeds at 20 unobstructed tests, in the last 6 months.
- Press reports are a separate, unverified layer and never enter crowd medians. As of Oct 5, 2026, 0 reports had been received.
On this page
The Starlink Availability USA dataset is built from anonymous reports that readers submit by county: what checkout showed (a surcharge and its amount, $0, or sold out) and, optionally, a speed test. Each report passes automatic checks, an outlier hold if it’s unusual, a duplicate check and a human review. Accepted reports from the last 6 months are then grouped by county, and a county shows numbers only once it has at least 5 surcharge reports or 20 unobstructed speed tests. Press reports are logged separately and never mixed in.
This page walks through every step with the real rules, says what gets rejected and why, and lists the limits that no process removes. The short version of the rules lives on the method page; this is the long version.
The pipeline, step by step
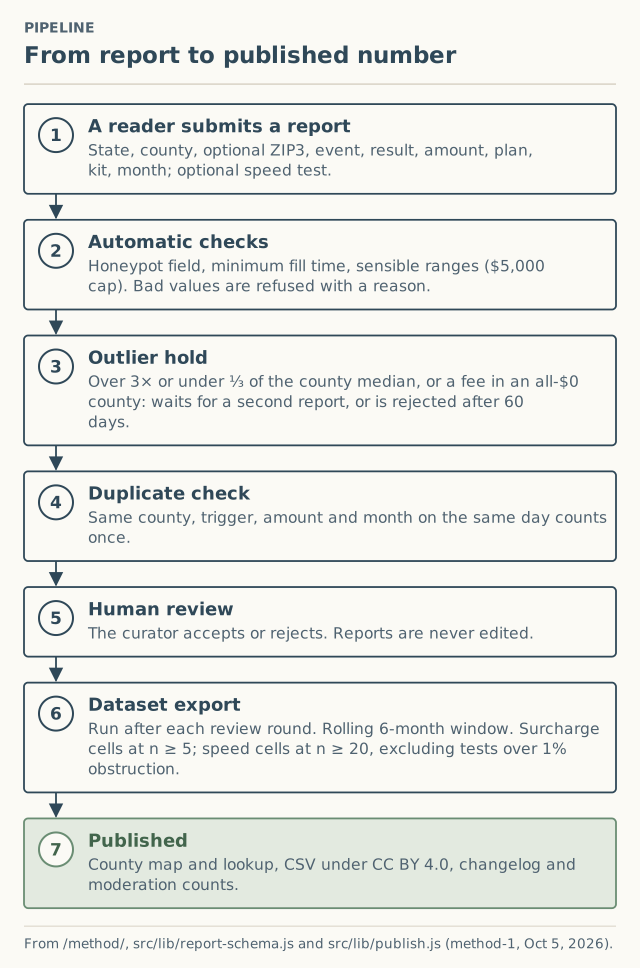
1. A reader submits a report
The report form asks for:
| Field | Values | Required? |
|---|---|---|
| State and county | Dropdowns | Yes |
| First 3 ZIP digits | e.g. 985 | Optional |
| What you were doing | New order, reactivation, address change, plan switch, Mini or Roam activation | Yes |
| What checkout showed | A surcharge with an amount, $0, or sold out / at capacity / waitlist | Yes |
| Amount | Whole dollars, up to $5,000 | If a surcharge |
| Plan | Residential, Roam, Business or priority, Not sure | Yes |
| Kit | Rental, bought, Mini, Not sure | Yes |
| Month you saw it | Last 24 months | Yes |
| Speed test | Download, upload, latency, time band, tool, obstruction % | Optional |
The events match the moments Starlink’s surcharge article names: purchasing new service, activating a new plan, changing service address, and moving between addresses. Reactivation is its own option because Starlink’s help pages disagree on it.
There is no free-text box, so there’s nowhere to type an address by accident. Why we chose county over address is explained in why we never ask for your street address.
2. Automatic checks
Before a report reaches anyone:
- A hidden honeypot field catches most bots; a report submitted faster than 3 seconds after the form loads is treated as a bot.
- Values outside sensible ranges are refused with a message saying why: amounts above $5,000, download above 1,000 Mbps, upload above 300 Mbps, latency outside 1 to 2,000 ms, months older than 24.
- A “$0” surcharge must be reported as “No surcharge,” and amounts must be whole dollars.
- To stop one person flooding a county, the server makes a one-way hash of a secret salt, the date and the IP address, and counts against it for 24 hours. The hash is stored apart from reports and deleted automatically after 24 hours.
3. Outlier hold
An amount is flagged if it’s more than 3 times or less than a third of the county’s current accepted median, or if it’s any non-zero amount in a county where every accepted report is $0. A flagged report waits until a second, independent report agrees, or is rejected as “outlier, unconfirmed” after 60 days. Honest-but-unusual quotes aren’t thrown away; they just need company.
4. Duplicate check
Identical reports for the same county, trigger, result, amount and month received on the same day count once.
5. Human review
The curator reads every report and accepts or rejects it. Reports are never edited. Rejections use one of six reason categories:
| Reason | Example |
|---|---|
| Duplicate | The same report sent twice on one day |
| Outlier, unconfirmed | A flagged amount with no second report after 60 days |
| Implausible | Speeds a tool can’t show, or an amount that doesn’t match how checkout shows a surcharge |
| Out of scope | Not one of the events the form covers |
| Personal data | Should be impossible (no free text); if it happens, the row is deleted and intake paused |
| Bot | Caught by the automatic checks |
Monthly totals of received, accepted, rejected and pending, with rejections by reason, are published on the data page. As of October 5, 2026: 0 received, 0 accepted, 0 rejected, 0 pending.
6. Export: thresholds and the window
After each review round, accepted reports are exported and grouped by county:
- Window: the last 6 whole calendar months. As of the October 2026 export, that’s May to October 2026.
- Surcharge cell: published at n ≥ 5 accepted reports. Shows the median, range, most common trigger, and first and newest month.
- Speed cell: published at n ≥ 20 tests, excluding tests with more than 1% obstruction. Shows p25, median and p75 for download, upload and latency.
- State page: indexed by search engines only when at least 3 of its counties are published.
- Below threshold: “not enough reports yet” and the count so far. Never an estimate, never a neighbor’s numbers (why).
Map colors use five steps ($0, $1–249, $250–499, $500–999, $1,000+). “Not enough reports” is hatching, never a color. Details: how a county gets published.
7. Published
Each export updates the county lookup and map, the CSV files and the date shown in the site header. Any change to a rule (a threshold, the window, an exclusion) is logged in the public changelog on the method page and the data page. The first entry, “method-1,” is dated October 5, 2026.
Two layers that never mix
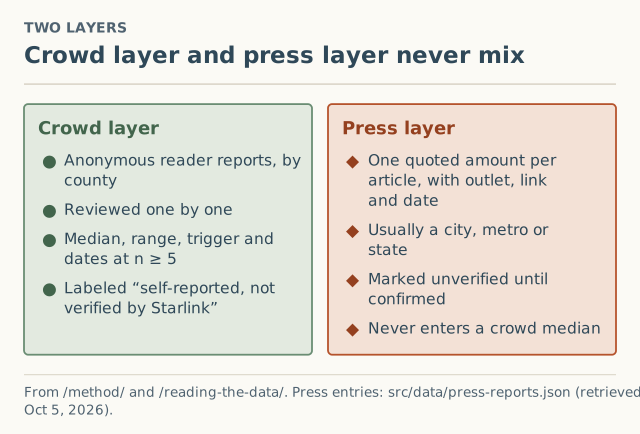
The press layer logs each news article that quoted a surcharge or sold-out area: outlet, link, publication date, the place named and the quoted amount. For example, Broadband Breakfast reported $750 for new customers in Portland, Seattle, Spokane and Coeur d’Alene on June 23, 2025. Press amounts stay “unverified” until a matching crowd report or a Starlink support article confirms them, and they never enter a county median, because one quote for a metro on one date isn’t a county’s typical value. The press file has 64 rows as of October 5, 2026.
The open data
| File | One row per | Notes |
|---|---|---|
| surcharges.csv | County with any accepted reports | Statistics filled only where n ≥ 5 |
| speeds.csv | County with any accepted tests | Statistics filled only where n ≥ 20 |
| press-reports.csv | Press entry | All amounts unverified |
All three are free under CC BY 4.0: credit “Starlink Availability USA” with a link, and say the data is self-reported. The crowd files have headers and no rows yet. Individual reports are never published; only county totals. Journalists can find citation wording on the press page.
Limits no process removes
- Self-selection. People who saw a surprising fee are more likely to report than people who saw $0. We ask for $0 results specifically and say so.
- Lag. A 6-month window smooths noise but responds slowly when a surcharge changes quickly.
- Address-level variation. Starlink sets the surcharge by service address and plan. Two addresses in one county can see different results, so a county median is a guide, not your quote.
- No verification by Starlink. We can’t check reports against Starlink’s systems.
- No follow-up. We don’t collect contact details, so we can’t ask a reporter to clarify. That’s the privacy trade-off we chose.
Following one report through (hypothetical)
A reader in a mid-sized county checks out for a new Residential kit in September 2026 and sees a $250 surcharge line. Here is what happens to their report:
- Submit. They choose their state and county, skip ZIP3, pick “Ordering a new kit,” “A surcharge, with an amount,” type 250, choose Residential, “Kit I bought,” and September 2026. No speed test.
- Automatic checks. The amount is a whole number under $5,000, the fields are all on the list, and the form took longer than 3 seconds. It’s queued as pending.
- Outlier check. The county has three accepted reports: $0, $250 and $500, a median of $250. $250 is within 3 times and a third of that, so it isn’t flagged.
- Duplicate check. No identical report arrived that day.
- Review. The curator accepts it. Nothing is edited.
- Export. The county now has 4 accepted reports in the May–October 2026 window. Still hatched: “4 reports so far.”
- Next report. When a fifth accepted report arrives, the county publishes a median, range, most common trigger (here, new order) and the months covered.
If the reader had typed 2,500 by mistake, the outlier rule would have held it (more than 3 times the median) until a second report agreed or 60 days passed.
Common misreadings
- “The site says Starlink charges $X here.” No: readers reported a median of $X over a dated window. Starlink publishes no amounts.
- “Hatched means no fee.” It means not enough reports yet.
- “Press and crowd numbers disagree, so one is wrong.” They measure different things. See reading the data.
What to do next
- Read the rules in one place on the method page.
- See how the thresholds and window work in how a county gets published.
- Add your own result, $0 included, on the report form. It takes about two minutes and asks for your county only.
Questions people ask
Where does Starlink Availability USA's surcharge data come from?
Can fake reports get into the data?
Do you edit reports?
How often is the data updated?
Can I use the data?
Is the data verified by Starlink?
Sources
- Starlink support: What is a demand surcharge? (modified Apr 9, 2026) (retrieved Oct 6, 2026)
- Creative Commons: Attribution 4.0 International (CC BY 4.0) (retrieved Oct 6, 2026)
- Broadband Breakfast: Starlink imposes $750 surcharge on new customers in major northwestern US cities, Jun 23, 2025 (retrieved Oct 5, 2026)
Related guides
Method
How a county gets published: the n ≥ 5 and n ≥ 20 rules
When a county gets Starlink surcharge or speed numbers on this site: 5 reports or 20 tests in a rolling 6-month window, what a published cell shows, and why.
Method
Why our Starlink report form never asks for your street address
Our Starlink surcharge and speed report form takes your county, never your address. Why county is enough, why ZIP3 only, and what we never collect or share.
Method
Why “not enough reports yet” is an answer, not a gap
Why a hatched county on our Starlink surcharge and speed maps shows no number until 5 reports (or 20 speed tests), and why a guessed number would be worse.