Key takeaways
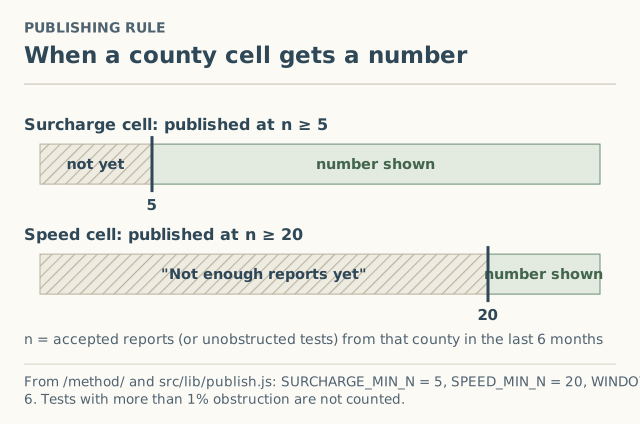
- A county's surcharge cell publishes at 5 or more accepted reports in the last 6 whole calendar months.
- A county's speed cell publishes at 20 or more tests in the same window, excluding tests with more than 1% obstruction.
- As of the October 2026 export, the window is May through October 2026. Older reports stay in raw data but aren't counted.
- A state page is indexed only when at least 3 of its counties are published. County pages are created only when a county qualifies.
- Changing any of these numbers is a method change, logged with a date in the public changelog.
On this page
- The two thresholds
- The rolling 6-month window
- Worked example: one county over time (hypothetical)
- What happens to unusual reports
- Why there are no county pages yet
- How the colors work once a county publishes
- Changing the rules
- Reading a published cell, field by field
- What the threshold doesn’t protect against
- Why counties, and not ZIP codes or cities
- What we don’t know
- Common misreadings
- What to do next
- Questions people ask
- Sources
A county gets a published surcharge number on this site once it has at least 5 accepted reports from the last 6 whole calendar months, and published speed numbers once it has at least 20 tests in the same window, not counting tests with more than 1% obstruction. Until then the county is hatched and shows “not enough reports yet” with the count so far. There are no estimates, no borrowed numbers from neighbors, and no county pages for counties that haven’t qualified.
These thresholds are written into the site’s code (one file that the pages, the CSV export and the tests all read) and on the method page. This guide explains each rule, what a published cell contains, how the window rolls, and why we chose these numbers.
The two thresholds
| Cell | Publishes at | What counts toward n | What it shows |
|---|---|---|---|
| Surcharge | n ≥ 5 | Accepted reports in the window: surcharges with an amount, $0 results, and sold-out results | Median, lowest and highest amount, most common trigger, first and newest month |
| Speed | n ≥ 20 | Accepted tests in the window with 1% obstruction or less | p25, median and p75 for download, upload and latency |
| State page | 3+ published counties | Published county cells | Indexed by search engines; otherwise kept out of search |
Why 5 for surcharges
With 2 or 3 reports, one unusual quote moves the median a lot. In a made-up example, two quotes of $0 and $500 have a median of $250; add one $1,500 quote and it becomes $500. With 6 quotes ($0, $250, $250, $250, $500, $500) the same added quote leaves the median at $250. Five is the smallest count where a median starts to mean “typical here.” Full walk-through: why “not enough reports yet” is an answer.
Why 20 for speeds
Speed tests swing much more than surcharge quotes, even at one house. Starlink says speeds “may vary or be slower” during peak hours, “typically between 6pm and 11pm local time.” Twenty tests are enough for p25 and p75 to mean something; see reading p25, median and p75.
Why obstructed tests don’t count
A dish with trees in its view and a congested area look the same on a speed test. We want county cells to describe the area, so tests with more than 1% app-reported obstruction are kept in the raw data but excluded from medians.
The rolling 6-month window
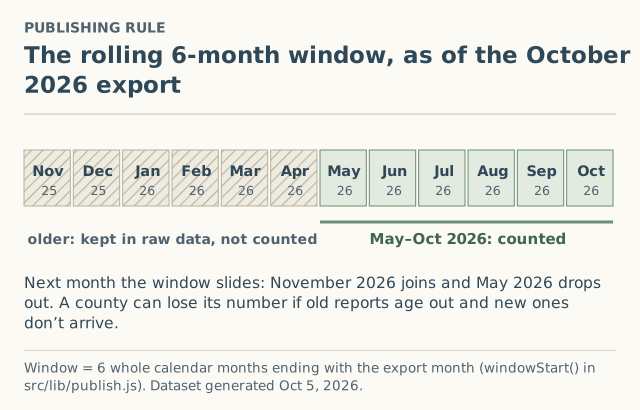
The window is the last 6 whole calendar months, including the month of the export, using the month the reader saw the result (not the day we received it). For the October 2026 export that’s May through October 2026. Next month, November joins and May drops out.
Why a window at all? Surcharges change. SatelliteInternet.com reported on January 27, 2026 that Pacific Northwest surcharges of up to $1,000 had dropped to $500, while $1,500 was appearing in Alaska (press layer, unverified). Starlink itself says “pricing, availability, and surcharge amounts may change based on network capacity and regional demand.” A median that mixed two-year-old quotes with last month’s would describe nobody’s checkout.
The cost is lag: a 6-month window responds slowly when a fee changes quickly. We say so on the method page, and every cell shows its first and newest month so you can see how fresh it is.
Worked example: one county over time (hypothetical)
| Export month | Window | Accepted reports in window | Cell shows |
|---|---|---|---|
| Nov 2026 | Jun–Nov 2026 | 2 | Hatched, “2 reports so far” |
| Jan 2027 | Aug 2026–Jan 2027 | 4 | Hatched, “4 reports so far” |
| Feb 2027 | Sep 2026–Feb 2027 | 6 | Median, range, most common trigger, Sep 2026–Feb 2027 |
| Aug 2027 | Mar–Aug 2027 | 3 (older ones aged out) | Hatched again, “3 reports so far” |
Made-up counts. The point of the last row: a published number isn’t permanent. If readers stop reporting, the county goes quiet, which is more honest than showing a stale median forever.
What happens to unusual reports
An amount more than 3 times or less than a third of the county’s current median, or any fee in a county where every accepted report is $0, is held until a second independent report agrees, or rejected after 60 days. Held reports don’t count toward n while they wait. A median also resists outliers on its own: one $1,500 quote among six $250-range quotes doesn’t move it. Details in how the dataset is built.
Why there are no county pages yet
The site’s anti-thin rule: a county page exists only when the county has its own data above the threshold. State pages are indexed only when at least 3 of their counties are published. As of October 5, 2026 the dataset had 0 accepted reports, so no county or state page has been generated yet. The county lookup on the surcharge page still shows each county’s count, so you can see how close yours is.
How the colors work once a county publishes
Published surcharge medians fall into one of five color steps: $0, $1–249, $250–499, $500–999, $1,000+. The scale is readable with common color-vision differences. “Not enough reports” is hatching, never a color, so it can’t be mistaken for a value. $0 has its own step because it’s a real result.
Changing the rules
The thresholds, the window and the obstruction cutoff live in one file. Changing any of them is a method change, logged with a date in the changelog on the method page and the data page. The first entry, method-1, was published October 5, 2026: surcharge cells at n ≥ 5, speed cells at n ≥ 20, a rolling 6-month window, tests over 1% obstruction excluded, and press reports kept out of crowd medians.
Reading a published cell, field by field
When a county publishes, the same fields appear on the lookup and in the open CSV files. The surcharge file’s columns, from the data page:
| Field | Meaning | How to use it |
|---|---|---|
| n | Accepted reports in the window | Bigger is steadier; 6 is far less certain than 60 |
| window start / end | First and last month counted | Tells you how fresh the cell is |
| median | Middle amount among reports with an amount, including $0 | “Typical here,” not your quote |
| min / max | Lowest and highest amounts | The spread readers saw |
| sold-out reports | Count of sold-out results | A capacity signal, separate from fees |
| common trigger | Most frequent event (new order, reactivation, move…) | Tells you which situation the median mostly describes |
| layer | Always crowd, self-reported | Press data is in its own file |
The trigger matters more than it looks. A county whose reports are mostly reactivations describes existing owners; a new buyer’s checkout could differ. Read the median together with the trigger.
What the threshold doesn’t protect against
- Self-selection. People who saw a surprising fee are more likely to report. Five reports from surprised people can lean high. We ask for $0 results to balance it.
- Mixed plans and kits. A county’s reports can mix Residential and Roam, rental and owned kits. Starlink says the plan affects the surcharge.
- Address-level differences. Two addresses in one county can see different results.
- Coordinated false reports. Review, outlier holds and rate limits make it harder, not impossible.
That’s why every cell says “self-reported, not verified by Starlink,” and why your own checkout is always the quote that counts.
Why counties, and not ZIP codes or cities
Counties are the smallest area we publish because they’re large enough that a summary doesn’t point to a household, they cover every address (including rural areas outside city limits), and they have fixed public codes. The optional first three ZIP digits are kept in the raw data to spot differences inside very large counties, but never published below county level. More on that choice in why we never ask for your street address.
What we don’t know
- Whether 5 is the right floor everywhere. It stops the worst swings. It isn’t a guarantee: a county with 6 reports is much less certain than one with 60, which is why every cell shows n.
- How quickly counties will qualify. That depends entirely on readers reporting.
Common misreadings
- “Published means verified.” It means enough reviewed reports exist. Cells are still “self-reported, not verified by Starlink.”
- “Hatched means no fee.” It means not enough reports yet.
- “The county median is my quote.” Starlink sets the fee by service address and plan. Your checkout is your quote (how to check it).
What to do next
- See all the rules together on the method page.
- Help your county cross the line: report what you saw, $0 included. It asks for your county, never your address.
Questions people ask
How many reports does a county need to show a Starlink surcharge?
How many speed tests does a county need?
What does a published county cell show?
Can a county lose its published number?
Do $0 reports and sold-out reports count toward the 5?
Why don't you estimate counties with fewer reports?
Sources
- Starlink support: What is a demand surcharge? (modified Apr 9, 2026) (retrieved Oct 6, 2026)
- Starlink support: Slow Speeds - Outside/During Peak Hours (modified Apr 9, 2026) (retrieved Oct 6, 2026)
- SatelliteInternet.com: Starlink congestion surcharge, Jan 27, 2026 (retrieved Oct 5, 2026)
Related guides
Method
Why “not enough reports yet” is an answer, not a gap
Why a hatched county on our Starlink surcharge and speed maps shows no number until 5 reports (or 20 speed tests), and why a guessed number would be worse.
Method
How the Starlink Availability USA dataset is built, start to finish
Every step from an anonymous Starlink surcharge or speed report to a published county number: form checks, outlier holds, human review, thresholds and the CSV.
Speeds
Reading p25, median and p75 on a Starlink speed page
What p25, median and p75 mean on a Starlink speed result, why we show them instead of an average, and how to compare them with Starlink's plan speed ranges.