Key takeaways
- A hatched county means fewer than 5 accepted surcharge reports (or 20 unobstructed speed tests) in the last 6 months. It shows the count so far, never an estimate.
- With 2 reports, one extra $1,500 quote can double the median, from $250 to $500. With 6 reports, the same quote leaves it at $250.
- We never fill a county with a neighbor's numbers, a state average or a model. Two addresses in one county can already see different results.
- As of Oct 5, 2026 the record had 0 accepted reports, so every county is hatched. That's the honest starting point.
- Your own checkout is the only real quote, whatever a county shows.
On this page
- What a hatched county is telling you
- Why two reports can’t make a median
- Why we don’t fill the gaps
- The other reasons a county can stay hatched
- Self-selection: the bias we can’t remove
- What you can do while your county is hatched
- Reading the count on a hatched cell
- Questions to ask of any Starlink surcharge map
- Why we publish the count at all
- What we don’t know
- Common mistakes
- What to do next
- Questions people ask
- Sources
“Not enough reports yet” means a county has fewer than 5 accepted surcharge reports, or fewer than 20 unobstructed speed tests, from the last 6 months. We show it as hatching with the count so far, and no number, on purpose. Below those floors, one unusual report can move a county’s median by hundreds of dollars, so any number we published would describe one person’s checkout rather than what’s typical where you live.
It is also, right now, the answer for every county. As of October 5, 2026, the dataset had received 0 reports. This guide explains why we chose an empty cell over a guess, shows the math that makes small samples misleading, and says what you can do while your county fills up.
What a hatched county is telling you
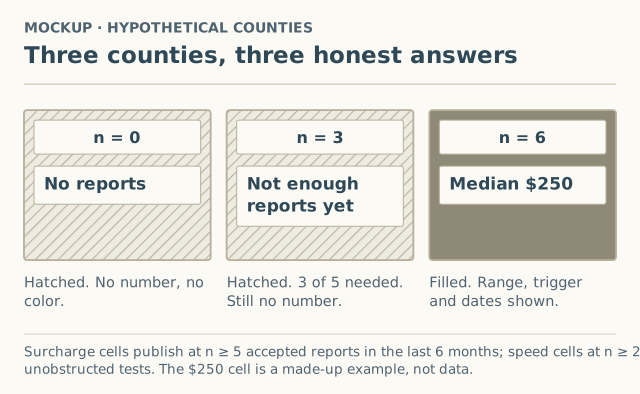
A county cell can be in one of three states:
| Cell | What it shows | What it means |
|---|---|---|
| Hatched, n = 0 | “No reports” | Nobody from that county has reported yet |
| Hatched, n = 1 to 4 (surcharges) or 1 to 19 (speeds) | “Not enough reports yet” and the count | Reports are arriving, but not enough to summarize |
| Filled | Median, range, most common trigger, dates (or p25/median/p75 for speeds) | At least 5 reports (or 20 tests) in the last 6 months |
Hatching is a pattern, not a color, so it can’t be mistaken for a low or high value on the map’s color scale. “Not enough reports” is never one of the color buckets.
Why two reports can’t make a median
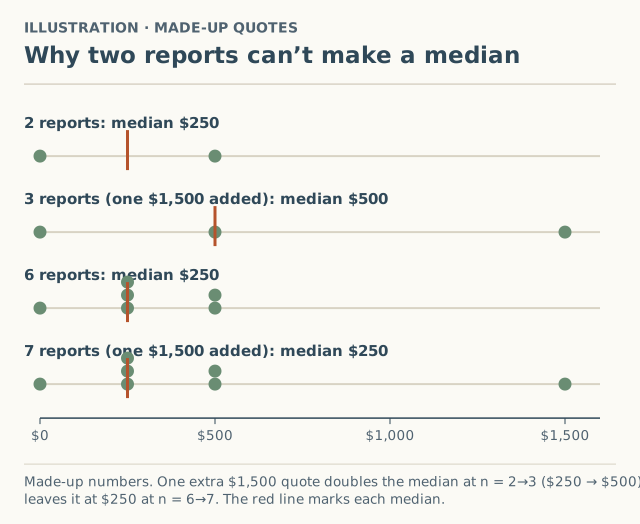
A median is the middle value when you line up every report. It’s sturdy with enough reports and fragile without them. Here’s the same extra report added to a small and a larger set. The amounts are made up.
| Reports in the county | The amounts | Median |
|---|---|---|
| 2 | $0, $500 | $250 |
| 3 (one $1,500 added) | $0, $500, $1,500 | $500 |
| 6 | $0, $250, $250, $250, $500, $500 | $250 |
| 7 (one $1,500 added) | $0, $250, $250, $250, $500, $500, $1,500 | $250 |
With 2 reports, a single new quote doubled the number we’d show. With 6, the same quote changed nothing. Five is the smallest count where a median starts to mean “typical here” instead of “whoever happened to report.”
Why would one quote be so different from the rest? Starlink sets the surcharge by “your service address” and “the service plan selected,” and applies it at specific moments: a new order, a new plan, a move. Two people in one county can be on different plans, at different addresses, months apart. Small samples mix those differences together.
Why speeds need 20
Speed tests vary much more than surcharge quotes, even at one house: time of day, Wi-Fi, other devices, weather. Starlink’s own support article says peak hours are “typically between 6pm and 11pm local time,” when “you may experience varying or slower speeds.” Twenty tests gives a median and a middle range (p25 to p75) that one bad evening can’t drag around. More on reading those in p25, median and p75.
Why we don’t fill the gaps
Plenty of maps would show a color everywhere by borrowing from neighbors, averaging up to the state, or using a model. We don’t, for three reasons:
- A neighbor isn’t you. The surcharge follows the service address and plan. A neighboring county’s reports are about different addresses.
- Press numbers aren’t local medians. Press reports quote one amount for one city or state on one date. Broadband Breakfast reported $750 for new customers in Portland, Seattle, Spokane and Coeur d’Alene on June 23, 2025 (unverified). That’s a dated fact about those places, not the median for any county. We keep the press layer separate and never mix it into county numbers.
- A guess looks exactly like data. Once a number is on a map, readers can’t tell it was filled in. An empty cell can’t be misread.
The rule is written into the site’s code and method page: “Never an estimate, never a neighbor’s numbers.”
The other reasons a county can stay hatched
- Reports age out. The window is the last 6 whole calendar months. A county with 5 reports from last spring can drop back to hatched if no new ones arrive. See how the rolling window works.
- Reports wait in review. An amount more than 3 times, or less than a third of, the county’s current median, or any fee in a county where every accepted report is $0, waits until a second independent report agrees, or is rejected after 60 days.
- Obstructed speed tests don’t count. Tests with more than 1% obstruction are kept in the raw data but excluded from county medians.
- Duplicates count once. Identical reports for the same county, trigger, amount and month received on the same day count as one.
The whole pipeline, from submission to published cell, is in how the dataset is built.
Self-selection: the bias we can’t remove
People who saw a surprising fee are more likely to report than people who saw $0. Even at 5 reports, a county’s median could lean high for that reason. We ask for $0 results specifically to balance it, and we say so on the method page. It’s one more reason the threshold is a floor, not a guarantee.
What you can do while your county is hatched
- Check your own checkout. It’s the only real quote at your address. Start an order with your real address and plan, and stop at the summary (how).
- Read the press layer for context, with dates. The surcharge page shows dated press reports separately, marked unverified.
- Add your result, $0 included. The report form takes about two minutes and asks for your county, never your address.
Reading the count on a hatched cell
A hatched cell isn’t empty: it shows how many accepted reports the county has so far, and that number is useful on its own.
| Count shown | What it tells you | What to do with it |
|---|---|---|
| 0 | Nobody has reported from this county yet | Your report would be the first |
| 1–2 | A few people saw something; no pattern yet | Don’t read anything into the amounts |
| 3–4 | Close to publishing | One or two more reports will produce a median |
Counts include $0 and sold-out results. A county close to 5 can publish within one export of new reports arriving.
Questions to ask of any Starlink surcharge map
Other sites and social posts sometimes show surcharge or speed maps. Before trusting one, ask:
- Where do the numbers come from? Starlink publishes no surcharge amounts, so any map is built from press quotes, reader reports or guesses.
- How many reports are behind each area? If the map doesn’t say, assume very few.
- What dates? A 2025 quote and a 2026 quote aren’t the same fact. Starlink says amounts “may change based on network capacity and regional demand.”
- Are empty areas filled in? If every area has a color, some colors are probably estimates.
- Are press quotes mixed with reader reports? They measure different things.
We publish our answers to all five on the method page.
Why we publish the count at all
We could hide counties below the threshold entirely. We show the count instead, for two reasons. First, it’s honest about how much we know: “3 reports so far” tells you the record exists and is growing, while a blank tells you nothing. Second, it shows readers in that county that one more report could make a difference. A county at 4 needs only one accepted report to publish; a county at 0 needs five. Showing the count turns an empty map into a list of places where a two-minute report is worth the most.
What we don’t know
- Exactly how many reports make a county “reliable.” Five is a floor that stops the worst swings, not a statistical guarantee. A county with 6 reports is still much less certain than one with 60, which is why every published cell shows its n.
- When counties will start publishing. That depends entirely on readers reporting.
Common mistakes
- Reading hatching as “no surcharge here.” It means “we don’t know yet.”
- Reading hatching as “Starlink isn’t available.” Availability is on Starlink’s map; see how to read it.
- Using a neighboring county’s number as your quote. Your checkout is your quote.
What to do next
- Learn the four ways readers misread the data on reading the data.
- See the exact thresholds in how a county gets published.
- Report what you saw. Every county starts at zero.
Questions people ask
What does “not enough reports yet” mean on the map?
Why not show the number anyway, with a warning?
Why is the threshold 5 for surcharges and 20 for speeds?
Why don't you use nearby counties to fill gaps?
How can I help my county get a number?
Sources
- Starlink support: What is a demand surcharge? (modified Apr 9, 2026) (retrieved Oct 6, 2026)
- Starlink support: Slow Speeds - Outside/During Peak Hours (modified Apr 9, 2026) (retrieved Oct 6, 2026)
- Broadband Breakfast: Starlink imposes $750 surcharge on new customers in major northwestern US cities, Jun 23, 2025 (retrieved Oct 5, 2026)
Related guides
Method
How a county gets published: the n ≥ 5 and n ≥ 20 rules
When a county gets Starlink surcharge or speed numbers on this site: 5 reports or 20 tests in a rolling 6-month window, what a published cell shows, and why.
Method
How the Starlink Availability USA dataset is built, start to finish
Every step from an anonymous Starlink surcharge or speed report to a published county number: form checks, outlier holds, human review, thresholds and the CSV.
Speeds
Reading p25, median and p75 on a Starlink speed page
What p25, median and p75 mean on a Starlink speed result, why we show them instead of an average, and how to compare them with Starlink's plan speed ranges.