Key takeaways
- Starlink states six causes of slower speeds in its support articles: peak-hour demand, local network capacity, plan caps, obstructions, Wi-Fi, and using the dish away from its service address.
- Peak hours are typically 6–11 pm local, per Starlink. Busy areas feel that more.
- The 200 Mbps and 100 Mbps Residential plans are capped, so plan mix alone makes places look different.
- Weather and latitude are often blamed, but the Starlink sources we read don't document them as causes. We treat them as unverified.
- Our county speed cells will show real differences once a county has 20 unobstructed tests. None has yet.
On this page
- The causes, ranked by evidence
- Area causes: demand and capacity
- Customer causes: plan and location
- House causes: sky and Wi-Fi
- What isn’t documented: weather and latitude
- Worked example (hypothetical)
- What our data will (and won’t) show
- Which cause is yours? A quick diagnostic
- What a county median can’t tell you about your house
- Common mistakes
- What to do next
- Questions people ask
- Sources
Starlink speed varies by location mainly because of how busy the network is in each area, especially at peak hours, and because of which plan people are on. Starlink states both: peak hours are “typically between 6pm and 11pm local time,” when speeds “may vary or be slower,” and it manages capacity area by area, marking regions sold out and charging demand surcharges where demand is high. At the level of a single house, obstructions, Wi-Fi and using the dish away from its registered address make a large difference too.
Some explanations you’ll read elsewhere, like weather or how far north you live, aren’t documented in the Starlink sources we read. Below, each cause is ranked by how well it’s supported, with Starlink’s wording where it exists.
The causes, ranked by evidence
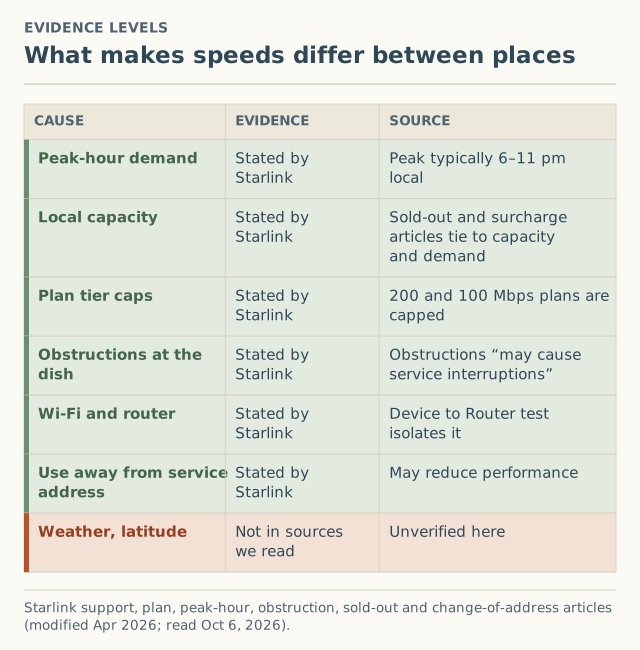
| Cause | Area or house? | Evidence |
|---|---|---|
| Peak-hour demand | Area | Stated by Starlink |
| Local network capacity | Area | Stated by Starlink (sold-out and surcharge articles) |
| Plan tier caps | Customer | Stated by Starlink |
| Obstructions | House | Stated by Starlink |
| Wi-Fi and router | House | Stated by Starlink |
| Using the dish away from its service address | Customer | Stated by Starlink |
| Weather, latitude | Area | Not documented in the sources we read |
Area causes: demand and capacity
Peak hours
Starlink’s slow-speeds article: “Peak hours are the times during the day when many Starlink users are trying to use their service at the same time (typically between 6pm and 11pm local time). While we do our best to optimize performance for all users, you may experience varying or slower speeds during these times of peak usage.”
Every area has an evening peak. What differs is how many users share the capacity over that area. That’s why the same plan can feel different in two counties, and why we record the time band of every test.
Local capacity
Starlink doesn’t publish capacity by area, but it acts on it in two visible ways:
- Sold out. When a region shows as sold out, “residential service is at capacity and residential service activations are currently not possible.” Starlink limits new users rather than letting existing users slow down.
- Demand surcharges. A one-time surcharge “may apply” in “locations where network demand is high,” and Starlink says amounts “may change based on network capacity and regional demand.”
Press coverage linked the two early on. Blandin on Broadband, citing PCMag on September 20, 2024, described the then-$100 congestion charge in states including “Texas, Florida, Kansas, Ohio and Virginia, among others, which have slower Starlink speeds due to the limited network capacity” (unverified). Neither sold-out status nor a surcharge tells you your speed, but both tell you Starlink considers the area busy. Our surcharge map and sold-out log record those signals.
Customer causes: plan and location
Plan caps
Starlink’s stated ranges for US Residential plans (verified October 5, 2026):
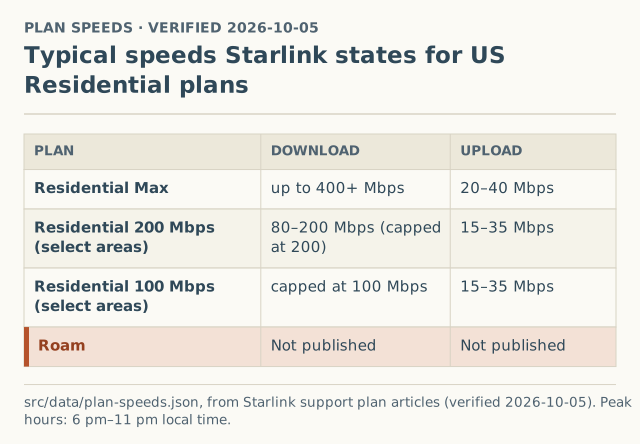
The 200 Mbps plan (formerly Residential Lite) “may be slower at peak” than Residential, Starlink says, and both it and the 100 Mbps plan are “select areas” only. A county where many households are on capped plans will show a lower median than one where most are on Residential Max, even if the network is identical. That’s a reason to compare like with like; our upload and download page has more on the ranges.
Using the dish away from its service address
Starlink’s change-of-address article: “Using your Starlink equipment outside of its assigned service area may result in loss of connectivity or reduced performance.” Its slow-speeds checklist starts with: “Ensure your Starlink is being used in the correct service location listed on your account.” A Residential dish used at a cabin or on a trip without updating the address can be slower for that reason alone.
House causes: sky and Wi-Fi
Obstructions
Starlink: “Objects such as a tree branch, pole or roof, that obstruct this connection between Starlink and the satellite, may cause service interruptions.” Obstructions differ from one yard to the next, which is why two neighbors can see very different results. It’s also why our speed cells exclude tests with more than 1% obstruction: we want to measure the area, not the trees. Fixing obstructions isn’t something we cover; the app’s “Check for Obstructions” tool is the place to start.
Wi-Fi and the router
Starlink’s advice for consistent slowness “throughout the day” is that it “may be a Router/WiFi issue or your local setup.” Its app’s Device to Router test checks that: “If this number is lower than your router speed test, you may be bottlenecked by your WiFi connection.” Distance from the router, the 2.4 GHz band and third-party hardware all show up in speed tests as if they were the network.
What isn’t documented: weather and latitude
You’ll often read that weather or latitude explain speed differences. The Starlink support articles we read for this guide (plans, peak hours, obstructions, sold-out regions, surcharges, address changes) don’t list either as a cause of slower speeds. We couldn’t verify them from a Starlink source, so we don’t make claims about them here. Our report form doesn’t collect weather. If there’s a north-south pattern in US speeds, county medians will show it once enough tests arrive.
Worked example (hypothetical)
Two households, same evening, same county line:
| Household A | Household B | |
|---|---|---|
| Plan | Residential Max | Residential 100 Mbps |
| Sky | Clear | 4% obstructed |
| Test device | Laptop, wired | Phone, two rooms from router, 2.4 GHz |
| Time | 7:30 pm (Evening band) | 7:30 pm (Evening band) |
| Middle of three | Higher | Lower |
Before blaming “the area,” Household B has three house-level and plan-level reasons for a lower number: a capped plan, an obstruction above 1% (their test wouldn’t count in our medians), and a Wi-Fi bottleneck. Only after removing those does a comparison say anything about the network. The checklist in how to run a speed test that counts is built to strip them out.
What our data will (and won’t) show
Each accepted speed report includes the county, optional first three ZIP digits, download, upload, latency, time band, tool and obstruction percentage. Once a county has 20 unobstructed tests in 6 months, its cell shows a median with p25 and p75 (how to read them). That will show that counties differ and by how much, separately by time band. It won’t show why for certain: we don’t record plan tier for speed tests, and we can’t see anyone’s Wi-Fi.
As of October 5, 2026, no county had reached 20 tests.
Which cause is yours? A quick diagnostic
| What you see | Most likely cause | Check |
|---|---|---|
| Slow only in the evening | Peak-hour demand in your area | Compare a morning and an evening test |
| Slow all day, Device to Router also low | Wi-Fi or router | Test wired or next to the router on 5 GHz |
| Slow all day, Device to Router fine | Plan cap, obstruction or location | Check your plan’s range, the app’s obstruction result and the service address |
| Drops and stalls rather than low speed | Obstructions | The app’s obstruction check |
| Download stops near 100 or 200 Mbps | Plan cap | The 100 and 200 Mbps plans are capped there |
| Slow since you took the dish somewhere else | Use away from the service address | Update the service address if you moved |
The first row is the one that varies most by location. The others mostly vary by house and plan, which is why two neighbors on the same network can report very different numbers.
What a county median can’t tell you about your house
Even once your county publishes, its median describes the county’s tests, not your roof. It mixes plans, houses with different sky views (within the 1% obstruction limit), different routers and different evenings. Use it to answer “is my experience normal here?”, not “what will I get?” If your middle-of-three tests sit well below the county’s p25 in the same time band, the cause is more likely at your house or on your plan than in the network, and the diagnostic table above is where to start.
Common mistakes
- Comparing your plan with a neighbor’s. A capped plan isn’t a slow network.
- Testing on Wi-Fi far from the router and blaming the area. Run Device to Router.
- Comparing evening tests with morning ones. Use the same band.
- Assuming a surcharge area is slow. It’s a sign of demand, not a speed measurement.
What to do next
- Run a comparable test: how to run a Starlink speed test that counts.
- Watch speeds by county for your county’s first published cell.
- Add your test. We ask for your county, never your address.
Questions people ask
Why is Starlink faster in some areas than others?
Does Starlink get slower in busy areas?
Does weather affect Starlink speed?
Is Starlink slower in the north?
Can I use my Residential Starlink somewhere else for better speed?
What speed should I expect where I live?
Sources
- Starlink support: Slow Speeds - Outside/During Peak Hours (modified Apr 9, 2026) (retrieved Oct 6, 2026)
- Starlink support: What are the Residential plans? (modified Apr 8, 2026) (retrieved Oct 6, 2026)
- Starlink support: What is the Residential 200 Mbps service plan? (modified Apr 9, 2026) (retrieved Oct 6, 2026)
- Starlink support: How to check for obstructions (modified Apr 9, 2026) (retrieved Oct 6, 2026)
- Starlink support: My region is at capacity or shows as "sold out" on the availability map. What does that mean? (modified Apr 9, 2026) (retrieved Oct 6, 2026)
- Starlink support: What is a demand surcharge? (modified Apr 9, 2026) (retrieved Oct 6, 2026)
- Starlink support: How do I change my service address? (modified Apr 9, 2026) (retrieved Oct 6, 2026)
- Blandin on Broadband (citing PCMag): Starlink charges $100 congestion charge, Sep 20, 2024 (retrieved Oct 5, 2026)
Related guides
Speeds
How to run a Starlink speed test that counts
Run a Starlink speed test you can compare: what to pause, which test to use, why three runs, which time band, the obstruction check, and what to record.
Speeds
Reading p25, median and p75 on a Starlink speed page
What p25, median and p75 mean on a Starlink speed result, why we show them instead of an average, and how to compare them with Starlink's plan speed ranges.
Coverage
Is Starlink available in my area? A step-by-step check
Check if Starlink is available at your address in four steps: the map, checkout, a surcharge check and a sky check. What each answer means and what to do next.