BackgroundIncludes press-layer reports
- Event date (reported)
- Published
- Last updated
Background This event is more than 90 days older than this page. It is kept here as dated context, not as current news.
What changed
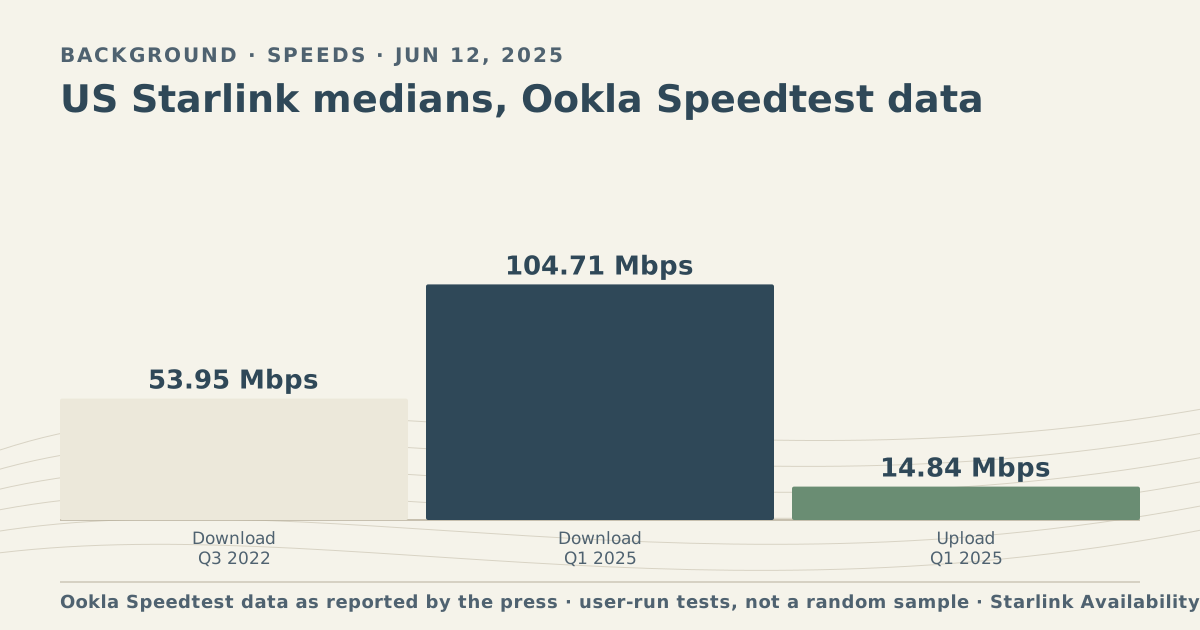
PCMag reported on June 12, 2025 that Ookla’s Speedtest data for Q1 2025 showed a US Starlink median download of 104.71 Mbps. In the article’s words: “Users on Starlink’s network experienced median download speeds nearly double from 53.95Mbps in Q3 2022 to 104.71Mbps in Q1 2025.”
The same report put the median upload at 14.84 Mbps and median latency at 45 ms, down from about 70 ms two years earlier. It said only about 17% of Starlink users met the FCC’s 100 Mbps down / 20 Mbps up broadband benchmark, mostly because of upload speeds.
What it means for you
This was the first quarter in Ookla’s series where the national Starlink median download passed 100 Mbps. It is useful context for anyone comparing their own speed test:
- A national median hides big local differences. Speeds depend on how busy your local cell is and on obstructions at your dish.
- Upload was the weak point in early 2025. If your uploads sat in the teens, that was typical, not a fault.
- Evening speeds are usually lower. Starlink’s help text names 6 pm to 11 pm local time as peak hours (our page on evening speeds covers this).
Who this covers
- People who ran Speedtest on a Starlink connection in the US during Q1 2025. It is not a random sample of all customers.
- The figures cover all Starlink plans that ran tests, not a single plan.
What you can check now
- Run a test at different times of day and compare with your plan’s stated range on our upload and download page.
- See how our speed pages handle crowd data: a county median is shown only once 20 or more reader tests exist.
What stays the same
Starlink’s support pages publish typical ranges per plan, not guarantees. Ookla’s numbers are medians from user-run tests, not a promise for any address.
What we don’t know yet
- State or county breakdowns for Q1 2025 from this report.
- How much of the gain came from new satellites versus network changes. The report did not split this out.
- How the figures compare with later quarters. Later Ookla reports are covered in separate items on this page.
Our data
None. Our speed cells need 20 or more reader tests per county, and the report form opened on October 5, 2026. Press-layer figures are never merged with crowd medians.
Source
PCMag report on Ookla Q1 2025 Starlink speeds (Yahoo Tech syndication) · reports Ookla Speedtest data
Retrieved Oct 6, 2026
Correction log
No corrections since publication.
Found an error? See corrections or contact. Fixes are made in place, dated and listed here.