BackgroundIncludes press-layer reports
- Event date (announced)
- Published
- Last updated
Background This event is more than 90 days older than this page. It is kept here as dated context, not as current news.
What changed
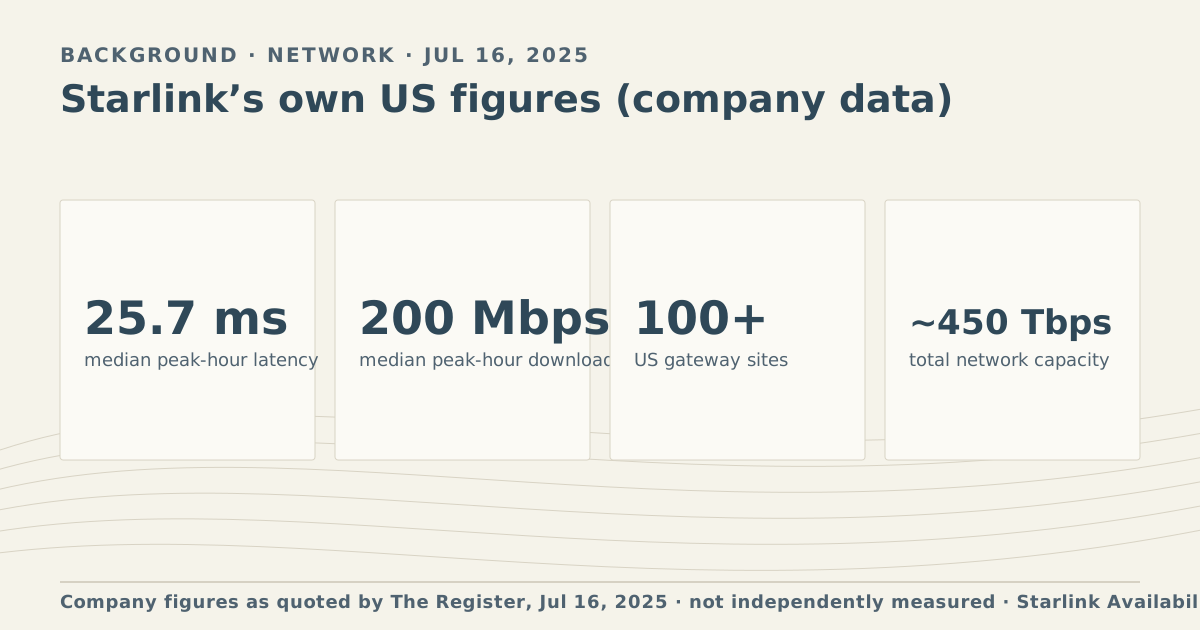
On July 16, 2025, The Register reported on a Starlink “network update” post. According to that report, Starlink said:
- Median peak-hour latency for US customers was 25.7 milliseconds.
- Median peak-hour download in the US was 200 Mbps.
- Starlink operated over 100 gateway sites in the US.
- Total network capacity was “nearly 450 Tbps”.
- SpaceX was “targeting to begin launching its third-generation satellites in the first half of 2026.”
Starlink also restated a goal of a stable 20 ms median latency.
What it means for you
These are Starlink’s own figures, and they differ from independent measurements. Ookla’s user-run Speedtest data for Q1 2025 put the US median download at 104.71 Mbps and latency at 45 ms (our item). The two are not measuring the same thing in the same way, so a gap is expected. Neither is a quote for your address.
The V3 target matters for capacity. Sold-out areas and high surcharges come from local congestion, so more capacity per satellite is the main lever that could ease them. In the event, the first V3 satellites flew on a Starship test flight in late July 2026, after the first-half target (our item).
Who this covers
- All US Starlink customers, as a national median from Starlink’s own data.
- The update did not give state or county figures.
What you can check now
- Your own app shows latency and recent speed. Compare tests at peak (6 pm to 11 pm local, per Starlink’s help text) with off-peak, as our time-of-day page suggests.
- Our speed pages show reader medians only where 20 or more tests exist for a county.
What stays the same
Peak hours are still the most congested period, and Starlink’s support pages still describe plan speeds as typical ranges.
Why company and Ookla numbers differ
Starlink’s figures come from its own network data across all customers. Ookla’s come from tests that users choose to run, at times they choose, on whatever plan and setup they have. Starlink’s update used “peak-hour” medians; Ookla’s quarterly figures are all-hours medians. Different methods give different numbers, and we show them side by side, never averaged.
What we don’t know yet
- How Starlink measures “median peak-hour” latency and download, beyond what the update states.
- How these figures have changed since July 2025. We have not found a later Starlink update with comparable US numbers.
- The exact current text of the update page, which we could not read directly because it is rendered in the browser.
Our data
None. Company figures are kept separate from both press and crowd layers.
Source
The Register report on Starlink's July 2025 network update
Retrieved Oct 6, 2026
Starlink network update (starlink.com) · page is client-rendered; figures here are as quoted by The Register
Retrieved Oct 6, 2026
Correction log
No corrections since publication.
Found an error? See corrections or contact. Fixes are made in place, dated and listed here.